01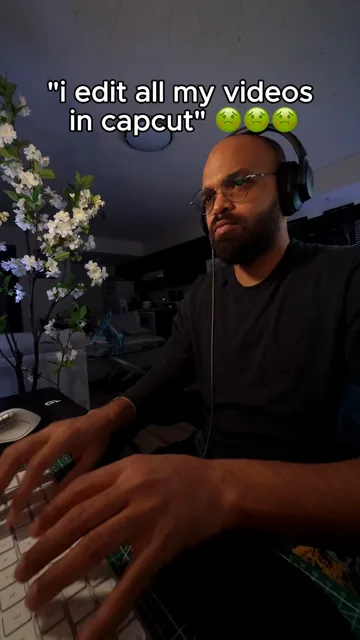
"editing just got way easier"
331K views
Case studyCanvas UGC
153 short videos for an AI video editing app, posted on my own Instagram, YouTube, TikTok and Facebook pages in the first 30 days, September 6 to October 5, 2026. I scripted, filmed, edited and posted every one, and a comment-to-DM setup sent 16,801 DMs, including the app link for everyone who asked for it.
The brand does not need its own account to run the content. I post it on pages I already own, so the brand gets the video and the audience in one move.
01Replay
Press play or drag the slider. Every chart in this section follows the same day.Day by day, from Sep 10 to Oct 5.
Tap a platform above to hide it. The chart rescales so the smaller 3 are easy to see.
Instagram carried 95% of the reach, so that is where the testing focused.
02Every video
Each dot is 1 of the 153 videos, placed by its best views. Hover or tap a dot to read its hook.
The typical video reached 2.4K views and the average was 13.2K, pulled up by the hits.
03Top 5
"editing just got way easier"
331K views
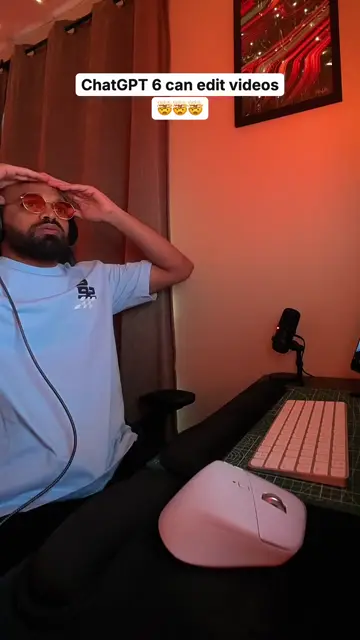
"ChatGPT 6 can edit videos now 🤯"
126K views
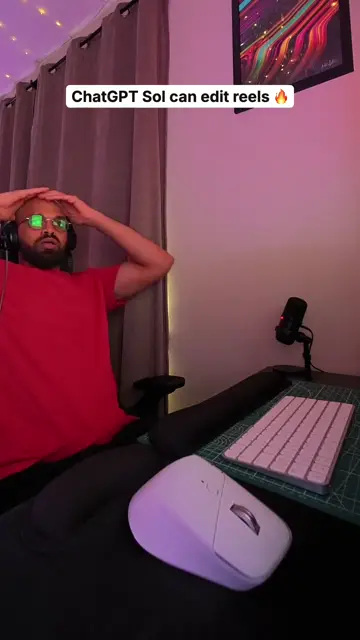
"ChatGPT Sol can edit reels now 🔥"
125K views
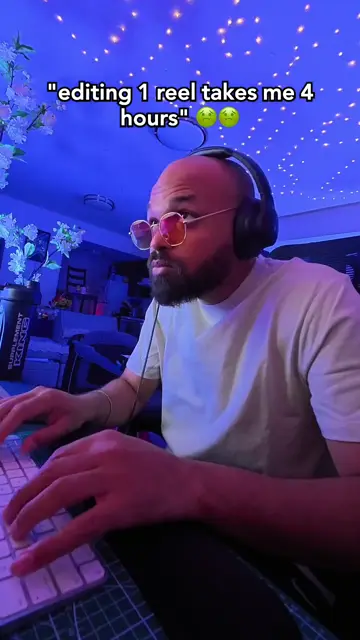
"manual editing takes forever 💀"
118K views
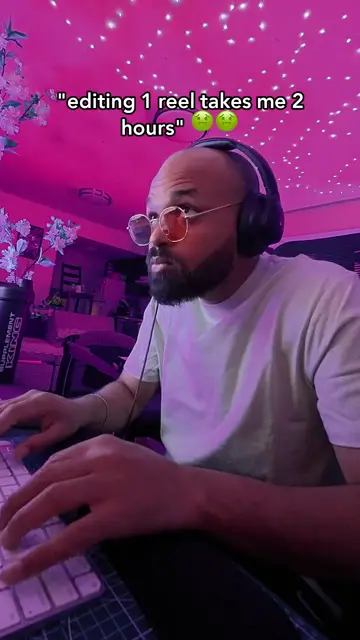
"editing takes forever 💀"
112K views
Hover or tap a card to play the first seconds of its hook.
04Views to DMs
Here is what every 1,000 views turned into. Keep scrolling to watch them filter down.
about2.9
got the link
56.2% of the people who got the DM
Every 1,000 views brought about 5.1 link requests, 8.0 DMs sent and 57 likes, comments, shares and saves.
3,662 customers were sent to the app, counted as unique people who clicked the link in the DM (4,092 clicks). That means sent, not signed up or paid. It is also a minimum: click counting was down from September 12 to 26, and in that stretch 1,957 link DMs went out but only 76 clicks were recorded. On the days counting worked, 88% of the people who got the link were counted as a visitor.
Link requests came in through comments and were answered by DM automatically on Instagram. DMs sent are the opening DM to each person who commented (10,714), the link DM after a button tap (6,021) and replies to DMs (66). Engagements are likes, shares and saves as the platforms report them, plus the 10,813 comments that asked for the link; the platforms' own comment totals also count my automated replies, so they are not used. Views from all 4 platforms count toward the total.
05What worked
The top video opens on 5 words, "editing just got way easier", and pulled 331K views.
I ran the same demo under different hooks and formats, then made more of whatever cleared 1K views in the first day.
Anyone who commented "link" got a DM automatically, and 6,021 of them tapped for the app link, out of 16,801 DMs sent in total.
My main page brought in 91% of the views and grew from 121 to 2,844 followers, while the 2 newer pages added the other 9%.
06Your numbers
CAC = cost per link DM ÷ your signup rate
Example budget for illustration only. The funnel rates are real, from this campaign. Plug in your own budget and signup rate.
Example: with a $10,000 budget and a 10% signup rate, that is a $4.75 CPM, $1.66 per link DM and a $16.61 CAC.
ugcbymoe.com ·
Numbers from my posting dashboard for the first 30 days of the campaign, September 6 to October 5, 2026, read on October 15, 2026. Views, likes, shares and saves are platform-reported. Cost figures are an illustrative example, not the real spend.